
The new research finds easterly winds in the tropical Pacific Ocean stalled a potential El Niño in 2014 and left a swath of warm water in the central Pacific. The presence of that warm water stacked the deck for a monster El Niño to occur in 2015, according to the study's authors.
El Niño and La Niña are the warm and cool phases of a recurring climate pattern across the tropical Pacific Ocean called the El Niño-Southern Oscillation, or ENSO. The warm and cool phases shift back and forth every two to seven years, and each phase triggers predictable disruptions in temperature, wind, and rain across the globe. During El Niño events, water temperatures at the sea surface are higher than normal. Low-level surface winds, which normally blow east to west along the equator, or easterly winds, start blowing the other direction, west to east, or westerly.
In the spring of 2014, strong westerly winds near the equator in the western and central Pacific Ocean created a buzz among scientists - they saw the winds as a sign of a large El Niño event to come in the winter of 2014, said Aaron Levine, a climate scientist at the NOAA Pacific Marine Environmental Laboratory in Seattle, Washington, and lead author of the new study accepted for publication in Geophysical Research Letters, a journal of the American Geophysical Union.
But as the summer progressed, El Niño didn't form the way scientists expected it to: sea surface temperatures in the eastern Pacific never warmed enough to truly be called an El Niño, and the buzz fizzled out.
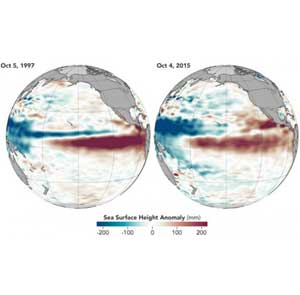
But then, in the spring of 2015, episodes of very strong westerly wind bursts occurred and became more frequent throughout the summer. Following a pattern set by previous large El Niños, 2015 to 2016 became one of the three strongest El Niños on record, along with 1982 to 1983 and 1997 to 1998, Levine said.
Levine and others wondered whether the stalled El Niño from 2014 and the monster El Niño of 2015 were somehow related, he said.
In the new study, Levine and co-author Michael McPhaden, fellow climate scientist at the NOAA Pacific Marine Environmental Laboratory, examined changes in sea surface and sub-surface temperatures, winds, and volumes of warm water in the Pacific Ocean from 2014 to 2016. They also used a mathematical model to analyze how these factors were related.
"As an El Niño develops and matures into its peak phase, [warm water] gets discharged out of the equatorial regions to the polar regions," Levine said. In 2014, easterly winds prevented that warm water from being transported poleward. The warm water stuck around through the winter and was available as a reservoir of heat that could be tapped into the following year. "Once we started to get some additional westerly winds - unusually strong westerly winds that occurred in the spring and summer of 2015 - an El Niño developed," he said.
Looking further back into the climate record, Levine and McPhaden found a similar event occurred in 1990. That year, easterly winds counteracted a budding El Niño, and leftover warm water fueled El Niño conditions in 1991 to 1992.
"It's nice to see that even in the 35-year record we have something similar that gives us confidence that this was the physical mechanism that was going on," Levine said.
While Levine's research shows what conditions can help to explain past El Niños, predicting future El Niños is much more difficult. For example, warm sea surface temperatures make it more likely for an El Niño to occur, but cannot be used to predict El Niños with absolute certainty, Levine said.
Sea surface temperatures and winds are closely coupled - meaning that they strongly influence each other, said Michelle L'Heureux, a climate scientist at NOAA's Center for Weather and Climate Prediction in College Park, Maryland, who was not involved in the new study. According to L'Heureux, certain winds are predictable to a certain degree, but there are still elements of surprise.
"The wildcard in all of this - the reason this is very probabilistic and we can't say anything with certainty - is that some part of the winds are essentially random," L'Heureux said. "We can predict them five to seven days out, but that's not going to give you much advance information on the growth of ENSO."
These random wind elements are a major limitation to predicting El Niño events, she said. "There's a chance that the winds could turn off in the summertime, and that's what happened in 2014."


Related Items
Same question this year...! Where has all the rainy water gone…?
Better water management helps halt the march of the desert in Rajasthan
Dal Lake shines with Khelo India Water Sports Festival