Latest News: Indian share markets will be open for trading on Sunday, February 01, as the Union Budget is being presented on that day * Key Highlights of Economic Survey 2025–26: GDP & GVA Growth Estimates for FY 2026: First advance estimates at 7.4% and 7.3% respectively * India’s Core Growth Projection: Around 7%, with real GDP growth for FY 2027 expected between 6.8% and 7.2% * Central Government Revenue: Rose to 11.6% of GDP in FY 2025 * Non-Performing Assets: Declined to a multi-decade low of 2.2% * PMJDY Accounts: Over 552 million bank accounts opened by March 2025; 366 million in rural and semi-urban areas * Investor Base: Surpassed 120 million by September 2025, with women comprising ~25% * Global Trade Share: India’s export share doubled from 1% in 2005 to 1.8% in 2024 * Services Export: Reached an all-time high of $387.6 billion in FY 2025, up 13.6% * Global Deposits: India became the largest recipient in FY 2025 with $135.4 billion * Foreign Exchange Reserves: Hit $701.4 billion on January 16, 2026—covering 11 months of imports and 94% of external debt * Inflation: Averaged 1.7% from April to December 2025 * Foodgrain Production: Reached 357.73 million metric tons in 2024–25, up 25.43 MMT from the previous year * PM-Kisan Scheme: Over ₹4.09 lakh crore disbursed to eligible farmers since inception * Rural Employment Alignment: “Viksit Bharat – Jee Ram Ji” initiative launched to replace MGNREGA in the vision for a developed India by 2047 * Manufacturing Growth: 7.72% in Q1 and 9.13% in Q2 of FY 2026 * PLI Scheme Impact: ₹2 lakh crore in actual investment across 14 sectors; production and sales exceeded ₹18.7 lakh crore; over 1.26 million jobs created by September 2025 * Semiconductor Mission: Domestic capacity boosted with ₹1.6 lakh crore invested across 10 projects * Railway High-Speed Corridor: Expanded from 550 km in FY 2014 to 5,364 km; 3,500 km added in FY 2026 * Civil Aviation: India became the third-largest domestic air travel market; airports increased from 74 in 2014 to 164 in 2025 * DISCOMs Turnaround: Recorded first-ever positive PAT of ₹20,701 crore in FY 2025 * Renewable Energy: India ranked third globally in total renewable and installed solar capacity * Satellite Docking: India became the fourth country to achieve autonomous satellite docking capability * School Enrollment Ratios: Primary – 90.9%, Upper Primary – 90.3%, Secondary – 78.7% * Higher Education Expansion: India now has 23 IITs, 21 IIMs, and 20 AIIMS; international IIT campuses established in Zanzibar and Abu Dhabi * Maternal & Infant Mortality: Declined since 1990, now below global average * E-Shram Portal: Over 310 million unorganised workers registered by January 2026; 54% are women * National Career Service Portal: Job vacancies exceeded 28 million in FY 2025 and crossed 23 million by September 2026

Canadian Glaciers Now Major Contributor To Sea Level Change…


From 2005 to 2015, surface melt off ice caps and glaciers of the Queen Elizabeth Islands grew by an astonishing 900 percent, from an average of three gigatons to 30 gigatons per year, according to results published today in the journal Environmental Research Letters.

“In the past decade, as air temperatures have warmed, surface melt has increased dramatically,” said lead author Romain Millan, an Earth system science doctoral student.

Ice loss from Canada’s Arctic glaciers has transformed them into a major contributor to sea level change, new research by University of California, Irvine glaciologists has found.The team found that in the past decade, overall ice mass declined markedly, turning the region into a major contributor to sea level change. Canada holds 25 percent of all Arctic ice, second only to Greenland.

The study provides the first long-term analysis of ice flow to the ocean, from 1991 to 2015.

The Canadian ice cap has glaciers on the move into the Arctic Ocean, Baffin Bay and Nares Strait. The researchers used satellite data and a regional climate model to tally the “balance” of total gain and loss each year, and the reasons why. Because of the huge number of glaciers terminating in area marine basins, they expected that discharge into the sea caused by tide water hitting approaching glacier fronts would be the primary cause.

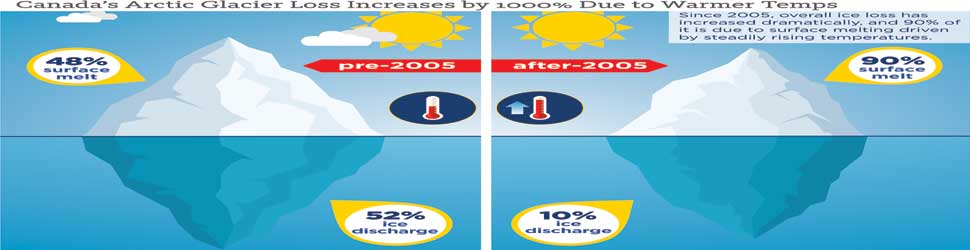
In fact, they determined that until 2005, the ice loss was caused about equally by two factors: calving icebergs from glacier fronts into the ocean accounted for 52 percent, and melting on glacier surfaces exposed to air contributed 48 percent. But since then, as atmospheric temperatures have steadily climbed, surface melt now accounts for 90 percent.

Millan said that in recent years ice discharge was only a major component in a few basins, and that even rapid, short term increases from these ice fields only had a minor impact on the long-term trend.

Millan added, “We identified meltwater runoff as the major contributor to these ice fields’ mass loss in recent years. With the ongoing, sustained and rapid warming of the high Arctic, the mass loss of the Queen Elizabeth Islands area is likely to continue to increase significantly in coming decades.”