
According to a new study in the journal Science Advances, the hotspot softened the mantle rock beneath Greenland in a way that ultimately distorted their calculations for ice loss in the Greenland ice sheet. This caused them to underestimate the melting by about 20 gigatons (20 billion metric tons) per year.
That means Greenland did not lose about 2,500 gigatons of ice from 2003-2013 as scientists previously thought, but nearly 2,700 gigatons instead —a 7.6 percent difference, said study co-author Michael Bevis of The Ohio State University.
“It’s a fairly modest correction,” said Bevis, the Ohio Eminent Scholar in Geodynamics, professor of earth sciences at Ohio State and leader of GNET, the Greenland GPS Network.
“It doesn’t change our estimates of the total mass loss all over Greenland by that much, but it brings a more significant change to our understanding of where within the ice sheet that loss has happened, and where it is happening now.”
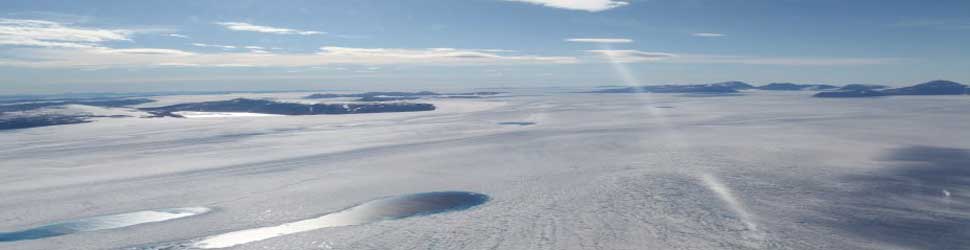
The Earth’s crust in that part of the world is slowly moving northwest, he explained, and 40 million years ago, parts of Greenland passed over an especially hot column of partially molten rock that now lies beneath Iceland. The hotspot softened the rock in its wake, lowering the viscosity of the mantle rocks along a path running deep below the surface of Greenland’s east coast.
During the last ice age, Greenland’s ice sheet was much larger than now, and its enormous weight caused Greenland’s crust to slowly sink into the softened mantle rock below. When large parts of the ice sheet melted at the end of the ice age, the weight of the ice sheet decreased, and the crust began to rebound. It is still rising, as mantle rock continues to flow inwards and upwards beneath Greenland.
The existence of mantle flow beneath Greenland is not a surprise in itself, Bevis said. When the Gravity Recovery and Climate Experiment (GRACE) satellites began measuring gravity signals around the world in 2002, scientists knew they would have to separate mass flow beneath the earth’s crust from changes in the mass of the overlying ice sheet.
“GRACE measures mass, period. It cannot tell the difference between ice mass and rock mass. So, inferring the ice mass change from the total mass change requires a model of all the mass flows within the earth. If that model is wrong, so is the ice mass change inferred from GRACE,” he explained.
Models of this rock flow depend on what researchers can glean about the viscosity of the mantle. The original models assumed a fairly typical mantle viscosity, but Greenland’s close encounter with the Iceland hot spot greatly changed the picture.
To the GNET team, the 7.6 percent discrepancy in overall ice loss is overshadowed by the fact that it concealed which parts of the ice sheet are most being affected by climate change. The new results reveal that the pattern of modern ice loss is similar to that which has prevailed since the end of the last ice age.
“This result is a detail, but it is an important detail,” Bevis continued. “By refining the spatial pattern of mass loss in the world’s second largest—and most unstable—ice sheet, and learning how that pattern has evolved, we are steadily increasing our understanding of ice loss processes, which will lead to better-informed projections of sea level rise.”
Computer models can give a good estimate of mantle flow and crustal uplift, he said, and GNET’s mission is to make those models better by providing direct observations of present-day crustal motion. That’s why the GNET team includes GRACE scientists and earth modelers as well as GPS experts and glaciologists.
The team used GPS to measure uplift in the crust all along Greenland’s coast. That’s when they discovered that two neighboring stations on the east coast were uplifting far more rapidly than standard models had predicted.
“We did not expect to see the anomalous uplift rates at the two stations that sit on the ‘track’ of the Iceland hot spot,” Bevis said. “We were shocked when we first saw them. Only afterwards did we make the connection.”
He added that the discovery holds big implications for measuring ice loss elsewhere in the world.
For instance, GNET has a sister network, ANET, that spans West Antarctica. It employs roughly similar numbers of GPS stations, but spread out over a vastly larger area. Unless more stations are added to ANET, anomalous rates of uplift may go undetected, Bevis cautioned, and analyses of GRACE data will lead to inaccurate estimates of ice loss in Antarctica.


Related Items
Buyers change their minds because of AI recommendations
Climate change is not a question of thermometer, but of the conscience…
How the winds of change reached a small shop…